Noticing less traffic, less leads or other negative trends on your website? Web design is not a one-and-done process, but is instead a gradual process of improving your site to get the results you’re looking for.
I love using Google Analytics to track how the design and organization of my website is performing. I use a technique called Growth Driven Design to make incremental changes and updates to my website.
Growth Driven Design includes 6 main steps:
- Launch a starter website
- Track analytics on the website regularly
- Note trends in page views, visitors, time on site, etc.
- Brainstorm reasons why these trends are happening and how to fix unwanted trends
- Choose 1-2 high impact fixes and implement them
- Repeat steps 2-5 regularly to create a high-performing website over time
Many companies make the mistake of launching a brand new website, and then just crossing their fingers and hoping for the best. A brand new website is great, but there’s still more to do! Each company’s audience is different. Web designers aren’t magicians, and can’t predict exactly how your audience will use your website. This is why using the Growth Driven Design (GDD) method is so important to creating a high-performing website.
How I Use Growth Driven Design
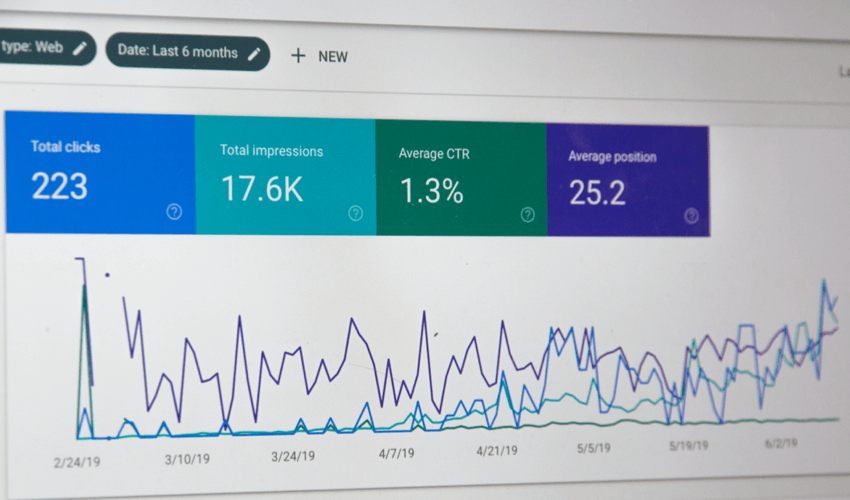
I just recently used the GDD process on my own website. I was doing my regular analysis (Step 2 of GDD!) of my Google Analytics, and noticed a drastic negative trend (Step 3). My page views on my case study pages (example here) were down about 90%! Case study pages are an important process in generating leads, so this was a big deal.
Instead of freaking out (okay, I admit, I did a little), I brainstormed ideas of why this was happening (Step 4). I realized that about a month ago, I had added a “Recent Projects” section to my website that looked like this:
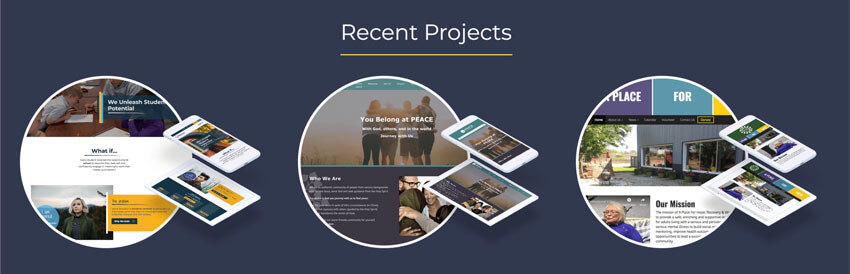
I added this section to get MORE traffic to these case study pages, not less. So what was the deal? I realized that this section didn’t look very clickable. Users were probably scrolling through, noticed the photos, and then moving on – not realizing that clicking one of the photos would bring them to a case study with more information.
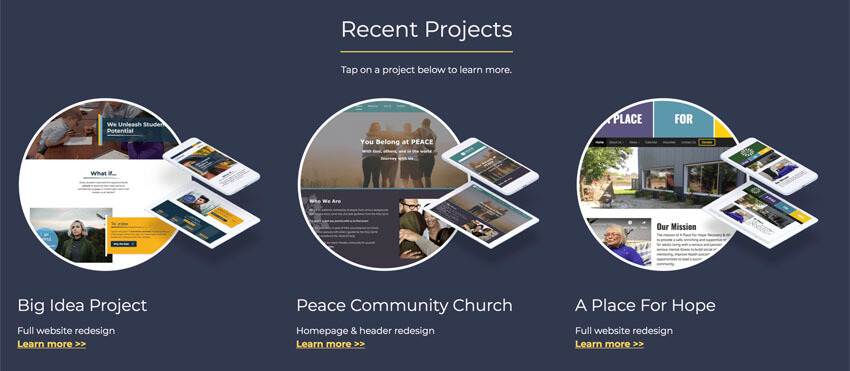
I decided to try adding more indicators of clickability to this section (step 5 of GDD).
- First, I added a simple prompt below the headline letting users know that if they tap a project, they can learn more about it.
- I also added a short text description and “Learn More” link beneath each project photo, making more of a standard info-card layout.
Take a look at the new section design below. Much more clickable, yeah?
Next Steps
I just made these changes to my website right before writing this blog article, so in a couple weeks, I’ll be doing step 6 of GDD. I’ll check analytics again and see if there is a positive trend of pageviews on my case study pages again. Hopefully this design change will make a difference, but if it doesn’t, I’ll just brainstorm another idea to try and repeat the process over again.
Want to try Growth Driven Design yourself? Start small, and make a goal to check your site’s Google Analytics (or other analytics) this week and start the brainstorming process. The key to a high-performing website is to repeat this process regularly to catch problems when they start and continually make your website better and better.
Have fun, and let me know how the GDD process is working for you!